Scatter Charts?
- RonCo
- GB: JL Frontier Division Director
- Posts: 19976
- Joined: Sat Nov 14, 2015 10:48 pm
- Has thanked: 2011 times
- Been thanked: 2976 times
Scatter Charts?
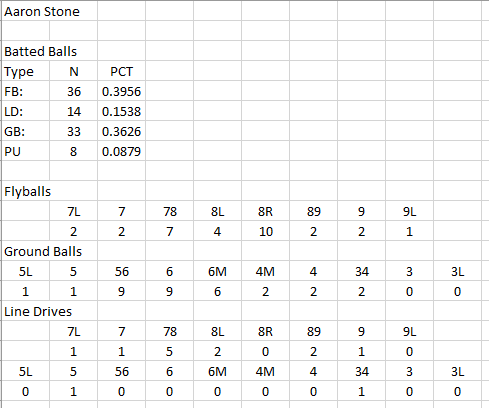
Hey...I'm finally getting some time to add to the script I've got...and I'm now able to create rudimentary scatter charts for our hitters. I can't do them in bulk, but I can do one at a time. Here's an example of one of my guys...Aaron Stone.
If you'd like me to run a player or three from any of your teams, let me know and I'll post them as I get time.
NOTE: This data is up to date through the end of May. It collects all depth zones into one (i.e the basic "6" zone includes balls hit to 6S, 6, and 6D).
Anyway...the "good news" here is that, at least in the case of Stone, OOTP's categories of "pull" and "flyball" seem to be playing out for him. He's getting something in the range of 63% of batted balls into the air, and he's mostly hitting to the left side of the field--especially ground balls and line drives (he's got quite a few fly balls into the right field side of center field so far.
I'll be working on and off on this most of the day, probably...I'm thinking of making it split the data by handedness of the pitcher (very helpful for switch hitters, I'd suppose), and a few other things. Any suggestions?
- RonCo
- GB: JL Frontier Division Director
- Posts: 19976
- Joined: Sat Nov 14, 2015 10:48 pm
- Has thanked: 2011 times
- Been thanked: 2976 times
Re: Scatter Charts?
Here's another guy. My shortstop Miguel Padilla. He's listed by OOTP as a spray hitter with a normal batted ball profile. Per this data, that looks about right. Padilla's all over the the field with his batted balls, though right now it looks like his line drive tendency is gently shading to the opposite field.
-
- Ex-GM
- Posts: 6652
- Joined: Wed Jul 05, 2017 9:39 am
- Location: Manama, Bahrain
- Has thanked: 207 times
- Been thanked: 776 times
Re: Scatter Charts?
Would be curious to see gillstrom. He has had a massive power surge this year (on pace for 60) and I'm wondering if the underlying numbers support that.
Randy Weigand
Havana Sugar Kings/San Fernando Bears: 32-50 (1608-1481)
Des Moines Kernels: 52-
League Champion- 34
JL Champion- 34
FL Champion- 36, 37
JL Southern- 34
FL Pacific- 37, 39
Wild Card- 33, 35, 36, 40, 43
Havana Sugar Kings/San Fernando Bears: 32-50 (1608-1481)
Des Moines Kernels: 52-
League Champion- 34
JL Champion- 34
FL Champion- 36, 37
JL Southern- 34
FL Pacific- 37, 39
Wild Card- 33, 35, 36, 40, 43
- RonCo
- GB: JL Frontier Division Director
- Posts: 19976
- Joined: Sat Nov 14, 2015 10:48 pm
- Has thanked: 2011 times
- Been thanked: 2976 times
Re: Scatter Charts?
Gillstrom is listed as a "normal" flyball hitter. He's getting about 67% of his balls in the air, somewhat scattered.
Your thought makes me think I should do a cut on home runs, too...I'll see if I can present where his home runs are being hit in a sec.
- RonCo
- GB: JL Frontier Division Director
- Posts: 19976
- Joined: Sat Nov 14, 2015 10:48 pm
- Has thanked: 2011 times
- Been thanked: 2976 times
Re: Scatter Charts?
Updated the chart above...Gillstrom is hitting homers to both right and left with equal aplomb...nothing to dead center, though.
- RonCo
- GB: JL Frontier Division Director
- Posts: 19976
- Joined: Sat Nov 14, 2015 10:48 pm
- Has thanked: 2011 times
- Been thanked: 2976 times
Re: Scatter Charts?
Interesting trivia (looked up after seeing Gillstrom's numbers). Very few HR's go to dead center...
All BBA Home Runs
All BBA Home Runs
Code: Select all
Zone N
7L 269
7 452
78 295
8L 19
8R 32
89 292
9 458
9L 334
- RonCo
- GB: JL Frontier Division Director
- Posts: 19976
- Joined: Sat Nov 14, 2015 10:48 pm
- Has thanked: 2011 times
- Been thanked: 2976 times
Re: Scatter Charts?
SFB's Tai hoi Wei is a left-handed pull hitter, though. Here's his breakout:
Overall, in limited checks, it's looking like the OOTP assignments of pull/normal/FB/spray are still behaving as you would expect that they would.
-
- Ex-GM
- Posts: 5630
- Joined: Thu Jun 04, 2015 2:50 pm
- Has thanked: 368 times
- Been thanked: 378 times
Re: Scatter Charts?
So it seems the players are representing their hitter types in terms of output. What would be interesting to know is does a 7/7/8/7/7 guy who is a pull hitter hit for more HR and lower babip than a 7/7/8/7/7 spray hitter. Or does the GB pull guy get killed on babip compared to an "identical" GB spray guy.
Ted Schmidt
Twin Cities Typing Nightmares(2044-present)
California Crusaders (2021-2038)
Twin Cities Typing Nightmares(2044-present)
California Crusaders (2021-2038)
- RonCo
- GB: JL Frontier Division Director
- Posts: 19976
- Joined: Sat Nov 14, 2015 10:48 pm
- Has thanked: 2011 times
- Been thanked: 2976 times
Re: Scatter Charts?
I'll have to think about how I can do that kind of thing...it would be hard even with the root files, and it's probably really hard with just the game logs.
In the meantime, here's an interesting learning:
Batter: % Home Runs Hit v.s Pitching Handedness
I'm not sure what this is supposed to be, and I'm not sure how our ballparks are affecting this...nor am I sure of our sample sizes needed to make this "real." But, it appears LHB pull homers a bit more often than RHB. RHB go opposite field 5-6% more than LHB. Pitcher handedness doesn't seem to make much of a difference, if any.
In the meantime, here's an interesting learning:
Batter: % Home Runs Hit v.s Pitching Handedness
BAT | PIT | LF | CF | RF |
---|---|---|---|---|
R | R | 55.2% | 2.0% | 42.8% |
R | L | 56.4% | 2.3% | 41.3% |
L | R | 35.8% | 2.6% | 61.5% |
L | L | 35.8% | 1.9% | 62.3% |
- RonCo
- GB: JL Frontier Division Director
- Posts: 19976
- Joined: Sat Nov 14, 2015 10:48 pm
- Has thanked: 2011 times
- Been thanked: 2976 times
Re: Scatter Charts?
As expected/hoped, though, it seems that pitcher handedness does influence ground ball location.
Batter: % GB Hit v.s Pitching Handedness
BAT | PIT | Left | Mid | Right |
---|---|---|---|---|
R | R | 51.4% | 13.8% | 34.8% |
R | L | 58.3% | 14.1% | 27.6% |
L | R | 27.9% | 14.1% | 58.0% |
L | L | 37.8% | 13.5% | 48.7% |
Who is online
Users browsing this forum: No registered users and 10 guests